The graphics card may potentially become a bottleneck for the processor's performance. Although the processor is powerful enough to handle demanding workloads, the graphics card's limited capabilities in terms of graphical processing could hinder the overall system performance. This mismatch might result in lower performance and reduced efficiency. To optimize the system, it would be beneficial to consider upgrading to a more powerful graphics card that can better complement the processor's capabilities.
AMD Radeon RX 6600 XT is too weak for AMD Ryzen 9 3900X on 6400 × 4800 pixels screen resolution for General Tasks.
This configuration has 22.3% of graphic card bottleneck .
During gameplay, it is possible that your processor may not reach its maximum performance due to the limitations of your graphics card. This means that the graphics card may struggle to process the data quickly enough, resulting in the processor not being fully utilized. Consequently, the utilization of your graphics card will be at its maximum while the processor's potential remains untapped.
In terms of bottlenecks, a graphics card bottleneck is considered preferable to a processor bottleneck. With a graphics card bottleneck, the utilization of the graphics card reaches its maximum capacity, allowing you to experience the optimal performance that the card offers. This ensures that you can enjoy the full potential of your graphics card's capabilities.
Moreover, one advantage of the processor not being maximally utilized is that it allows your CPU to handle other background programs efficiently. Since the processor is not operating at its maximum capacity during gaming, it can allocate resources to handle additional tasks, such as background processes or multitasking, without compromising performance. This provides flexibility and smoother overall system operation.
To address this issue, you have two potential solutions. The first is to upgrade your graphics card, which can help alleviate the bottleneck and improve overall gaming performance. Alternatively, you could consider downgrading your processor, although this may not be the most sensible approach as it can lead to a decrease in overall system performance.
In most cases, it is recommended to retain your current processor rather than downgrading it. Downgrading the processor may result in compromised performance and hinder your system's capabilities. By keeping your current processor, you can benefit from its processing power and allocate system resources to handle background tasks efficiently, without significantly impacting your gaming experience. Instead, focusing on upgrading the graphics card can provide a more effective solution in overcoming the bottleneck and enhancing your gaming visuals and performance.
If you encounter a processor bottleneck, raising the resolution of your display will significantly impact your graphics card, increasing its utilization. On the other hand, when facing a graphics card bottleneck, lowering the resolution will enable your graphics card to handle more data, resulting in higher frames per second.
It's important to note that higher frame rates will place a greater demand on your processor, as it needs to process and prepare more data for your graphics card. To alleviate this bottleneck, you can mitigate the impact by adjusting your screen resolution to one of the following options.
This can help reduce the strain on your graphics card, allowing it to process data more efficiently and potentially achieve higher frame rates.
While this may increase the load on your graphic card, it can help alleviate a potential processor bottleneck and provide a sharper and more visually immersive gaming experience.
By adjusting your screen resolution, you can optimize the balance between your processor and graphics card, ultimately enhancing overall system performance and achieving the desired gaming experience.
| Screen resolution | Ratio | Result | Playable | Average FPS (High settings) |
|---|---|---|---|---|
| 640 × 480 (nHD) | 4:3 | 8.7% | Yes | 295.3 FPS |
| 800 × 600 (SVGA) | 4:3 | 8.2% | Yes | 290.8 FPS |
| 1024 × 768 (XGA) | 4:3 | 7.3% | Yes | 282.9 FPS |
| 1280 × 800 (WXGA) | 8:5 | 6.5% | Yes | 276.7 FPS |
| 1280 × 720 (HD (720p)) | 16:9 | 6.8% | Yes | 279.4 FPS |
| 1280 × 1024 (SXGA) | 5:4 | 5.5% | Yes | 269.3 FPS |
| 1360 × 768 (HD) | 85:48 | 6.4% | Yes | 276.2 FPS |
| 1366 × 768 (HD) | 683:384 | 6.4% | Yes | 276.1 FPS |
| 1440 × 900 (WXGA+) | 8:5 | 5.5% | Yes | 269.6 FPS |
| 1600 × 900 (HD+ (900p)) | 16:9 | 5% | Yes | 265.9 FPS |
| 1680 × 1050 (WSXGA+) | 8:5 | 3.7% | Yes | 257.5 FPS |
| 1920 × 1200 (WUXGA) | 8:5 | 1.2% | Yes | 243.5 FPS |
| 1920 × 1080 (FHD (1080p)) | 16:9 | 2.3% | Yes | 249.5 FPS |
| 2048 × 1152 (QWXGA) | 16:9 | 0.9% | Yes | 242.1 FPS |
| 2560 × 1440 (QHD (1440p)) | 16:9 | 0% | Yes | 207.6 FPS |
| 2560 × 2048 (QSXGA) | 5:4 | 0% | Yes | 162.8 FPS |
| 2560 × 1600 (WQXGA) | 8:5 | 0% | Yes | 197.3 FPS |
| 2800 × 2100 (QSXGA+) | 4:3 | 0% | Yes | 148.3 FPS |
| 3200 × 2400 (QUXGA) | 4:3 | 5.3% | Yes | 118.7 FPS |
| 3200 × 1800 (WQXGA+) | 16:9 | 0% | Yes | 150.9 FPS |
| 3200 × 2048 (WQSXGA) | 25:16 | 1.9% | Yes | 135.6 FPS |
| 3440 × 1440 (Ultra-Wide QHD) | 43:18 | 0% | Yes | 170.3 FPS |
| 3840 × 2160 (4K UHD-1 (2160p)) | 16:9 | 6.8% | Yes | 111.1 FPS |
| 3840 × 1600 (Ultra-Wide 4K) | 12:5 | 0.4% | Yes | 143.1 FPS |
| 4096 × 3072 (HXGA) | 4:3 | 13.7% | Yes | 76.8 FPS |
| 5120 × 2880 (5K (2880p)) | 16:9 | 15.7% | Yes | 66.4 FPS |
| 5120 × 4096 (HSXGA) | 5:4 | 19.4% | No | 47.9 FPS |
| 5120 × 3200 (WHXGA) | 8:5 | 16.9% | Yes | 60.3 FPS |
| 5120 × 2160 (Ultra-wide 5K) | 64:27 | 11.8% | Yes | 86.2 FPS |
| 6016 × 3384 (6K) | 16:9 | 19.2% | No | 49.2 FPS |
| 11520 × 2160 (12K) | 16:3 | 20.9% | No | 40.7 FPS |
| Screen resolution | Ratio | Result | Playable | Average FPS (High settings) |
|---|---|---|---|---|
| 640 × 480 (nHD) | 4:3 | 8.7% | Yes | 295.3 FPS |
| 800 × 600 (SVGA) | 4:3 | 8.2% | Yes | 290.8 FPS |
| 1024 × 768 (XGA) | 4:3 | 7.3% | Yes | 282.9 FPS |
| 1280 × 800 (WXGA) | 8:5 | 6.5% | Yes | 276.7 FPS |
| 1280 × 720 (HD (720p)) | 16:9 | 6.8% | Yes | 279.4 FPS |
| 1280 × 1024 (SXGA) | 5:4 | 5.5% | Yes | 269.3 FPS |
| 1360 × 768 (HD) | 85:48 | 6.4% | Yes | 276.2 FPS |
| 1366 × 768 (HD) | 683:384 | 6.4% | Yes | 276.1 FPS |
| 1440 × 900 (WXGA+) | 8:5 | 5.5% | Yes | 269.6 FPS |
| 1600 × 900 (HD+ (900p)) | 16:9 | 5% | Yes | 265.9 FPS |
| 1680 × 1050 (WSXGA+) | 8:5 | 3.7% | Yes | 257.5 FPS |
| 1920 × 1200 (WUXGA) | 8:5 | 1.2% | Yes | 243.5 FPS |
| 1920 × 1080 (FHD (1080p)) | 16:9 | 2.3% | Yes | 249.5 FPS |
| 2048 × 1152 (QWXGA) | 16:9 | 0.9% | Yes | 242.1 FPS |
| 2560 × 1440 (QHD (1440p)) | 16:9 | 0% | Yes | 207.6 FPS |
| 2560 × 2048 (QSXGA) | 5:4 | 0% | Yes | 162.8 FPS |
| Screen resolution | Ratio | Result | Playable | Average FPS (High settings) |
|---|---|---|---|---|
| 2560 × 1600 (WQXGA) | 8:5 | 0% | Yes | 197.3 FPS |
| 2800 × 2100 (QSXGA+) | 4:3 | 0% | Yes | 148.3 FPS |
| 3200 × 2400 (QUXGA) | 4:3 | 5.3% | Yes | 118.7 FPS |
| 3200 × 1800 (WQXGA+) | 16:9 | 0% | Yes | 150.9 FPS |
| 3200 × 2048 (WQSXGA) | 25:16 | 1.9% | Yes | 135.6 FPS |
| 3440 × 1440 (Ultra-Wide QHD) | 43:18 | 0% | Yes | 170.3 FPS |
| 3840 × 2160 (4K UHD-1 (2160p)) | 16:9 | 6.8% | Yes | 111.1 FPS |
| 3840 × 1600 (Ultra-Wide 4K) | 12:5 | 0.4% | Yes | 143.1 FPS |
| 4096 × 3072 (HXGA) | 4:3 | 13.7% | Yes | 76.8 FPS |
| 5120 × 2880 (5K (2880p)) | 16:9 | 15.7% | Yes | 66.4 FPS |
| 5120 × 4096 (HSXGA) | 5:4 | 19.4% | No | 47.9 FPS |
| 5120 × 3200 (WHXGA) | 8:5 | 16.9% | Yes | 60.3 FPS |
| 5120 × 2160 (Ultra-wide 5K) | 64:27 | 11.8% | Yes | 86.2 FPS |
| 6016 × 3384 (6K) | 16:9 | 19.2% | No | 49.2 FPS |
| 11520 × 2160 (12K) | 16:3 | 20.9% | No | 40.7 FPS |
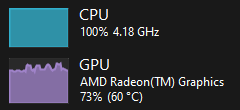
While running general tasks, processor AMD Ryzen 9 3900X will be utilized 58.4% and graphic card AMD Radeon RX 6600 XT will be utilized 83.1% .
However, it's important to note that these numbers represent theoretical maximums based on processor and graphics card usage ratios for specific purposes or games, and in real-world scenarios, achieving such high utilizations may be challenging.
These utilization ratios are based on the concept of workload distribution between the GPU and CPU. Generally, in games, the graphics card bears a heavier load compared to the processor. This is because modern games heavily rely on graphics processing for rendering high-quality visuals and complex 3D environments. By maximizing the usage of the graphics card and maintaining a high percentage of CPU utilization, you can ensure smooth gameplay, impressive graphics, and seamless multitasking.
It's important to note that these utilization ratios are theoretical and may vary depending on the specific workload, software optimization, and other factors. Nonetheless, striving for such balanced utilization between the CPU and GPU can help achieve the best possible performance in various applications and gaming scenarios.
Let's explore different scenarios where there are variations in component utilizations, which can indicate either a bottleneck or a specific dependency of a game or program on one component over the other:
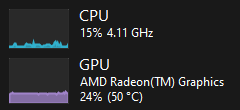
In a scenario where both the CPU and GPU exhibit low utilization, it indicates a relatively light workload that does not heavily tax the processing power of either component. When it comes to gaming, this could occur during less demanding games or in situations where the graphics settings are set to lower levels. The low utilization of both the CPU and GPU suggests that the system has ample resources available, which may result in smoother gameplay and the potential for the CPU to handle additional background tasks without causing performance issues.
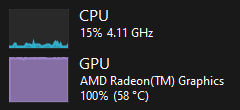
In contrast, when the CPU usage is minimal and the GPU usage reaches 100%, it suggests a situation where the workload is predominantly graphics-intensive. This indicates that the GPU is effectively utilized to its maximum potential, serving as the dominant component in handling the workload. The low CPU usage implies that the processor is not heavily involved in the specific task or program, potentially suggesting that it is less dependent on CPU processing power. However, it's important to note that this scenario could also indicate a GPU bottleneck in the system, where the graphics card is being pushed to its limits while the CPU has more capacity to spare.
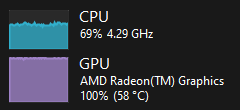
When the CPU usage is significantly high and the GPU usage reaches 100%, it suggests a situation where the workload heavily relies on the CPU for processing. While the CPU is operating at a high level, it is not necessarily at its maximum capacity, indicating that it still has some room to handle additional tasks. This scenario points towards a balanced system or a slight GPU bottleneck, where the graphics card is operating at its maximum potential while the CPU is handling the workload efficiently but not pushed to its limits.
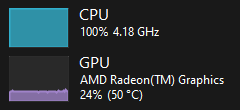
In a scenario where the CPU usage is at 100% and the GPU usage is very low, it implies a workload that is heavily dependent on CPU processing power but doesn't require extensive graphics processing. This could be the case for tasks such as heavy data computations or certain non-graphical applications. The low GPU usage suggests that the graphics card is not fully utilized in this particular workload, indicating a potential CPU bottleneck where the CPU is operating at its maximum capacity while the GPU is waiting for data from the CPU to process. This imbalance between the CPU and GPU utilization suggests that the system's performance may be constrained by the CPU's processing capabilities.
When the CPU usage is at maximum capacity while the GPU usage remains very high, it suggests a workload that heavily relies on the computational power of the processor. The CPU is operating at its full potential, handling complex calculations and tasks. Meanwhile, the high GPU usage indicates that the graphics card is also contributing significantly to the workload, assisting in rendering graphics and providing visual enhancements. This scenario indicates a balanced system or a slight CPU bottleneck, where the CPU is operating at its limits while the GPU is efficiently handling the graphics-intensive aspects of the workload. The overall performance of the system may be constrained by the CPU's processing capabilities, but the GPU is making a substantial contribution to the workload.
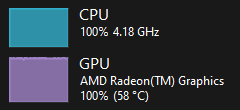
Lastly, in a scenario where both the CPU usage and GPU usage are at 100%, it suggests a workload that requires substantial computational power from both components. This balanced utilization indicates that the workload is evenly distributed between the CPU and GPU, with both components working at their full capacity. It's important to ensure that the system is adequately cooled and capable of handling the high utilization to prevent performance issues or overheating.
It's crucial to consider that a significant difference in component utilizations can indicate a potential bottleneck or simply reflect the nature of the workload, where certain games or programs are more reliant on one component than the other. Analyzing these utilization patterns can help identify system performance issues and optimize hardware configurations accordingly.
Product pricing and availability information was updated as of the date and time listed, but is subject to change. If you choose to purchase a product from a retailer, the price and availability displayed on their website at the time of purchase will apply. We may earn a commission from qualifying purchases made through the links to participating retailers on this site. However, this does not impact the products or prices that are displayed or the order in which prices are listed.
| Product name | Merchant | Available | Price |
Merchant
Available
Price
|
|---|---|---|---|---|
|
AMD Ryzen 9 3900X 12-core, 24-thread unlocked desktop processor with Wraith Prism LED Cooler 6 new from 395.00 $. 13 used from 299.00 $. Last updated 2 hours ago. |
|
Yes | 395.00 $ |
Yes
|
|
AMD Ryzen 9 3900XT 12-core, 24-Threads Unlocked Desktop Processor 6 new from 438.00 $. 3 used from 374.00 $. Last updated 2 hours ago. |
|
Yes | 450.00 $ |
Yes
|
Product pricing and availability information was updated as of the date and time listed, but is subject to change. If you choose to purchase a product from a retailer, the price and availability displayed on their website at the time of purchase will apply. We may earn a commission from qualifying purchases made through the links to participating retailers on this site. However, this does not impact the products or prices that are displayed or the order in which prices are listed.
Contribute to the calibration of our calculators by providing bottleneck and frames per second estimations. Your input will enable us to fine-tune our calculator, resulting in improved accuracy and allowing us to assist you in building a better PC tailored to your specific requirements.